Contain Virus
HardA virus is spreading rapidly, and your task is to quarantine the infected area by installing walls.
The world is modeled as an m x n binary grid isInfected, where isInfected[i][j] == 0 represents uninfected cells, and isInfected[i][j] == 1 represents cells contaminated with the virus. A wall (and only one wall) can be installed between any two 4-directionally adjacent cells, on the shared boundary.
Every night, the virus spreads to all neighboring cells in all four directions unless blocked by a wall. Resources are limited. Each day, you can install walls around only one region (i.e., the affected area (continuous block of infected cells) that threatens the most uninfected cells the following night). There will never be a tie.
Return the number of walls used to quarantine all the infected regions. If the world will become fully infected, return the number of walls used.
Example 1:
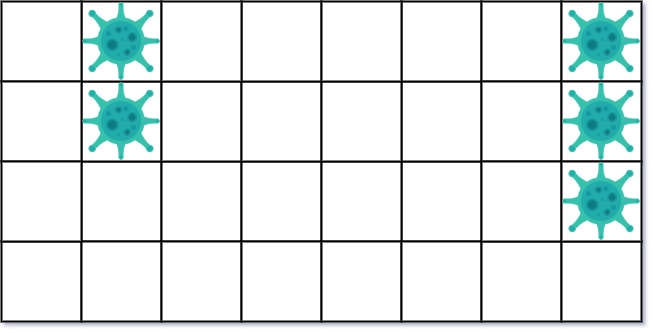
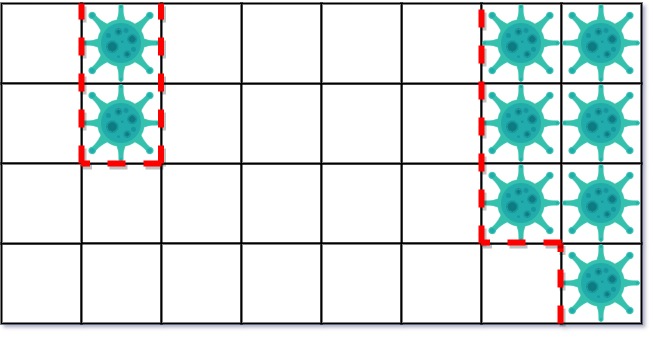
Input: isInfected = [[0,1,0,0,0,0,0,1],[0,1,0,0,0,0,0,1],[0,0,0,0,0,0,0,1],[0,0,0,0,0,0,0,0]] Output: 10 Explanation: There are 2 contaminated regions. On the first day, add 5 walls to quarantine the viral region on the left. The board after the virus spreads is:On the second day, add 5 walls to quarantine the viral region on the right. The virus is fully contained.
Example 2:

Input: isInfected = [[1,1,1],[1,0,1],[1,1,1]]
Output: 4
Explanation: Even though there is only one cell saved, there are 4 walls built.
Notice that walls are only built on the shared boundary of two different cells.
Example 3:
Input: isInfected = [[1,1,1,0,0,0,0,0,0],[1,0,1,0,1,1,1,1,1],[1,1,1,0,0,0,0,0,0]]
Output: 13
Explanation: The region on the left only builds two new walls.
Constraints:
m == isInfected.lengthn == isInfected[i].length1 <= m, n <= 50isInfected[i][j]is either0or1.- There is always a contiguous viral region throughout the described process that will infect strictly more uncontaminated squares in the next round.
Solution
Clarifying Questions
When you get asked this question in a real-life environment, it will often be ambiguous (especially at FAANG). Make sure to ask these questions in that case:
- What is the maximum size of the grid, i.e., the maximum values for M and N in the M x N grid?
- Can a region be completely surrounded by walls (i.e., all its cells are walls)? If so, how should I handle that?
- If there are multiple regions that can be contained in a single step, is there a preference for which region to contain?
- What are the possible values in the grid? Are they limited to 0 and 1, or could there be other values?
- How should I handle the case where the entire grid is already walled off (no virus present)?
Brute Force Solution
Approach
To contain the viruses, we'll explore every possible strategy of containment. The brute force approach simulates all possible actions and selects the best one. It exhaustively evaluates different firewall deployment plans to find the most effective method to limit virus spread.
Here's how the algorithm would work step-by-step:
- First, identify all the distinct regions of virus spread.
- For each region, determine the potential cost of containing that region with firewalls, and the potential spread if we don't contain it.
- Now, let's consider all possible combinations of containing or not containing each region.
- For each combination, calculate the total cost of building firewalls for the regions we choose to contain.
- Also for each combination, calculate the total spread of the virus if we don't contain certain regions.
- Compare all these scenarios to find the combination of firewall deployments and uncontained spread that results in the minimum total cost (firewall cost plus virus spread cost).
- The combination that gives us the lowest total cost is our brute force solution.
Code Implementation
def contain_virus_brute_force(infected_grid):
    rows = len(infected_grid)
    cols = len(infected_grid[0])

    def get_regions(grid):
        regions = []
        visited = set()

        def depth_first_search(row, col, current_region):
            if (row < 0 or row >= rows or col < 0 or col >= cols or
                (row, col) in visited or grid[row][col] == 0):
                return

            visited.add((row, col))
            current_region.add((row, col))

            depth_first_search(row + 1, col, current_region)
            depth_first_search(row - 1, col, current_region)
            depth_first_search(row, col + 1, current_region)
            depth_first_search(row, col - 1, current_region)

        for row in range(rows):
            for col in range(cols):
                if infected_grid[row][col] == 1 and (row, col) not in visited:
                    current_region = set()
                    depth_first_search(row, col, current_region)
                    regions.append(current_region)
        return regions

    regions = get_regions(infected_grid)
    number_of_regions = len(regions)
    minimum_cost = float('inf')

    # Explore all possible combinations of containing/not containing regions
    for i in range(2 ** number_of_regions):
        current_cost = 0
        current_spread = 0
        new_grid = [row[:] for row in infected_grid]

        regions_to_contain = []
        for region_index in range(number_of_regions):
            if (i >> region_index) & 1:
                regions_to_contain.append(region_index)

        # Calculate firewall cost and contain selected regions
        for region_index in regions_to_contain:
            current_cost += len(regions[region_index])
            for row, col in regions[region_index]:
                new_grid[row][col] = -1  # Mark as contained

        # Calculate the virus spread for uncontained regions.
        for region_index in range(number_of_regions):
            if region_index not in regions_to_contain:
                spreading_cells = set()
                for row, col in regions[region_index]:
                    neighbors = [(row + 1, col), (row - 1, col), (row, col + 1), (row, col - 1)]
                    for neighbor_row, neighbor_col in neighbors:
                        if (0 <= neighbor_row < rows and 0 <= neighbor_col < cols and
                            new_grid[neighbor_row][neighbor_col] == 0):
                            spreading_cells.add((neighbor_row, neighbor_col))
                current_spread += len(spreading_cells)

        minimum_cost = min(minimum_cost, current_cost + current_spread)

return minimum_costBig(O) Analysis
Optimal Solution
Approach
The goal is to contain viruses represented by connected regions on a grid by building firewalls along their borders. We want to minimize the number of uninfected cells that become infected while containing the viruses. The best approach is to focus on containing the virus that threatens the most uninfected cells in each step.
Here's how the algorithm would work step-by-step:
- Identify all distinct virus regions on the grid.
- For each virus region, determine how many uninfected cells it threatens to infect.
- Find the virus region that threatens the largest number of uninfected cells. This is the region we will contain first.
- Build a firewall around the selected virus region. Count the number of firewall cells needed to contain it.
- Infect all the uninfected cells threatened by the *other* virus regions (the ones we didn't build a firewall around).
- Repeat this process until there are no more virus regions left to contain.
Code Implementation
def contain_virus(infection_grid):
    rows = len(infection_grid)
    cols = len(infection_grid[0])
    total_firewall_count = 0

    while True:
        virus_regions = []
        threatened_cells_by_region = []
        visited = set()

        def depth_first_search(row_index, col_index, current_region, threatened_cells):
            if (row_index < 0 or row_index >= rows or col_index < 0 or
                    col_index >= cols or (row_index, col_index) in visited):
                return

            visited.add((row_index, col_index))

            if infection_grid[row_index][col_index] == 0:
                threatened_cells.add((row_index, col_index))
                return

            current_region.add((row_index, col_index))

            depth_first_search(row_index + 1, col_index, current_region, threatened_cells)
            depth_first_search(row_index - 1, col_index, current_region, threatened_cells)
            depth_first_search(row_index, col_index + 1, current_region, threatened_cells)
            depth_first_search(row_index, col_index - 1, current_region, threatened_cells)

        for row_index in range(rows):
            for col_index in range(cols):
                if infection_grid[row_index][col_index] == 1 and (row_index, col_index) not in visited:
                    current_region = set()
                    threatened_cells = set()
                    depth_first_search(row_index, col_index, current_region, threatened_cells)
                    virus_regions.append(current_region)
                    threatened_cells_by_region.append(threatened_cells)

        if not virus_regions:
            break

        # Find the region that threatens the most cells
        max_threat_index = 0
        max_threat_count = 0
        for index, threatened_cells in enumerate(threatened_cells_by_region):
            if len(threatened_cells) > max_threat_count:
                max_threat_count = len(threatened_cells)
                max_threat_index = index

        # Count the firewall cells needed for the selected region
        total_firewall_count += len(threatened_cells_by_region[max_threat_index])

        # Mark the selected region as contained (-1)
        for row_index, col_index in virus_regions[max_threat_index]:
            infection_grid[row_index][col_index] = -1

        # Infect cells threatened by other regions
        for index, virus_region in enumerate(virus_regions):
            if index != max_threat_index:
                for row_index, col_index in threatened_cells_by_region[index]:
                    infection_grid[row_index][col_index] = 1

return total_firewall_countBig(O) Analysis
Edge Cases
| Case | How to Handle |
|---|---|
| Empty grid (no regions) | Return 0 immediately as no firewall is needed. |
| Grid with only one cell | Return 0 if the cell is 0 (not infected), return area of cell if infected (1). |
| All cells are infected (all 1s) | Return the perimeter of the entire grid, as we need to firewall the whole thing. |
| All cells are uninfected (all 0s) | Return 0, as there is nothing to firewall. |
| Maximum grid size with many small, isolated infected regions | The algorithm's time complexity might be impacted by repeated explorations; ensure it doesn't lead to timeout. |
| Two infected regions are adjacent horizontally or vertically | The perimeter calculation should correctly account for shared edges, avoiding double-counting. |
| Integer overflow in perimeter calculation | Use a data type that can accommodate large perimeter values (e.g., long) during calculation. |
| Grid contains only a single large connected infected region | The algorithm should correctly identify and calculate the perimeter of the single region. |