
Minimum Lines to Represent a Line Chart
Medium
You are given a 2D integer array stockPrices where stockPrices[i] = [dayi, pricei] indicates the price of the stock on day dayi is pricei. A line chart is created from the array by plotting the points on an XY plane with the X-axis representing the day and the Y-axis representing the price and connecting adjacent points. One such example is shown below:

Return the minimum number of lines needed to represent the line chart.
Example 1:

Input: stockPrices = [[1,7],[2,6],[3,5],[4,4],[5,4],[6,3],[7,2],[8,1]]
Output: 3
Explanation:
The diagram above represents the input, with the X-axis representing the day and Y-axis representing the price.
The following 3 lines can be drawn to represent the line chart:
- Line 1 (in red) from (1,7) to (4,4) passing through (1,7), (2,6), (3,5), and (4,4).
- Line 2 (in blue) from (4,4) to (5,4).
- Line 3 (in green) from (5,4) to (8,1) passing through (5,4), (6,3), (7,2), and (8,1).
It can be shown that it is not possible to represent the line chart using less than 3 lines.
Example 2:
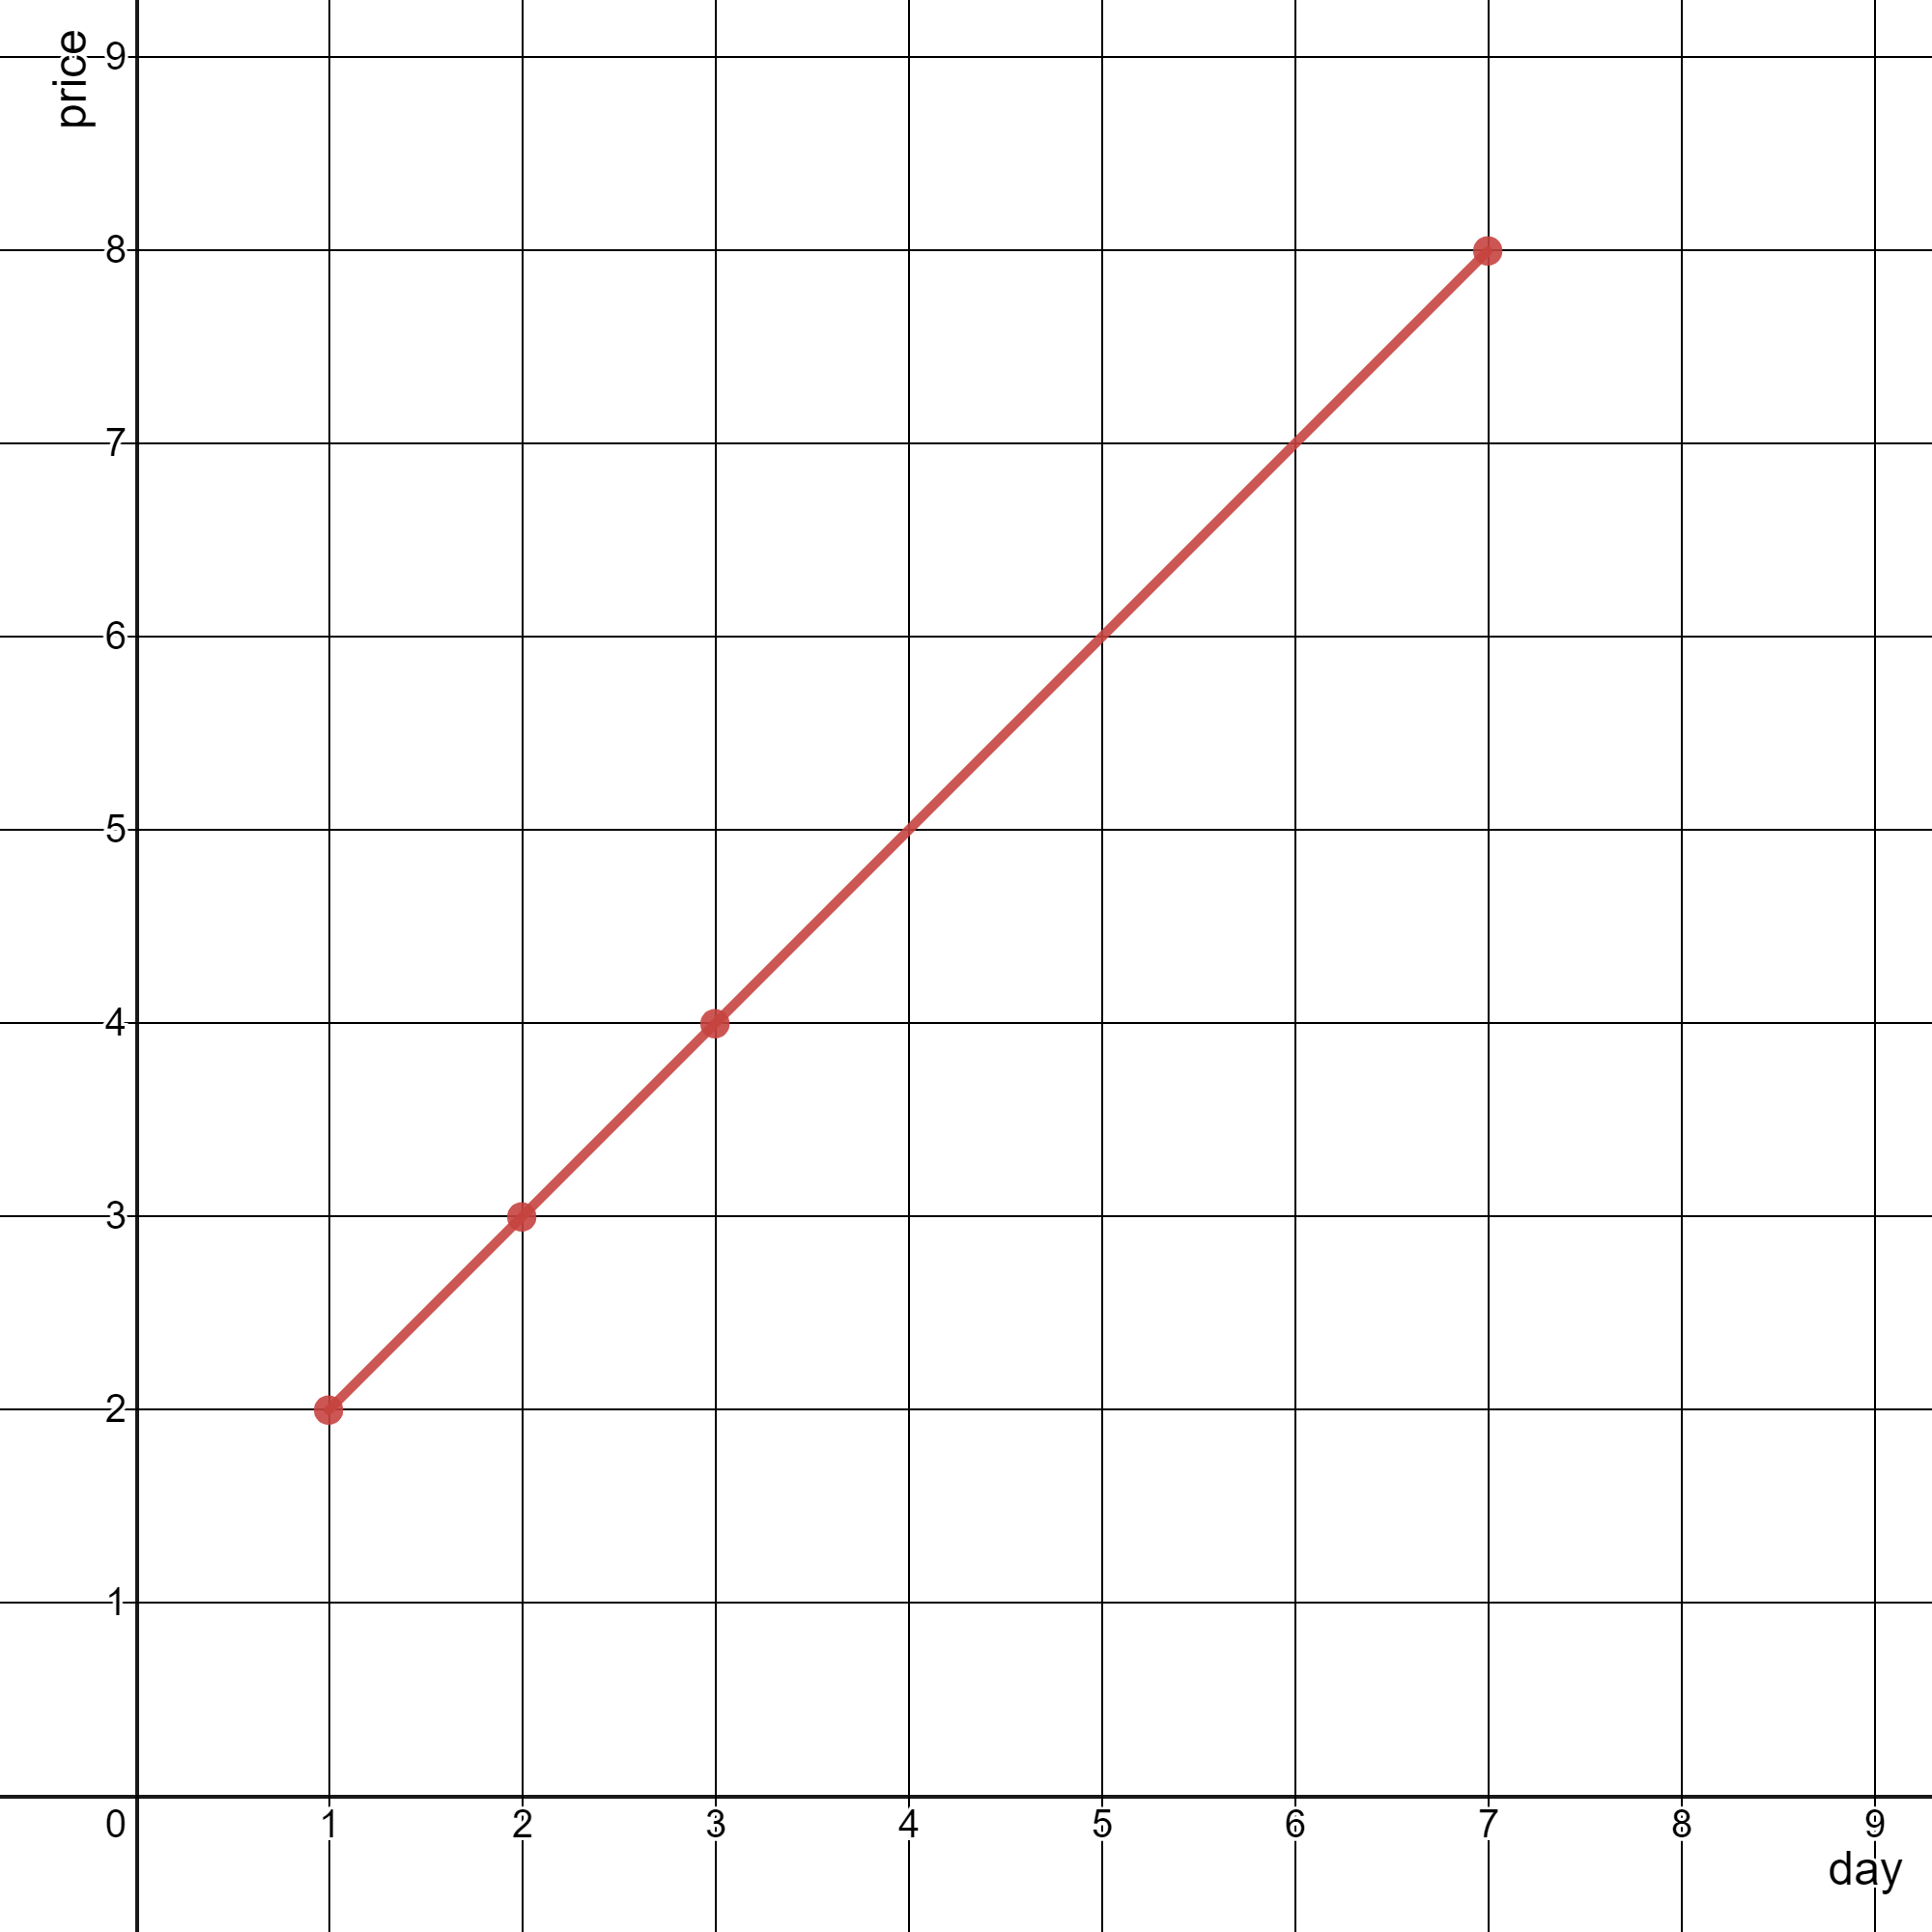
Input: stockPrices = [[3,4],[1,2],[7,8],[2,3]]
Output: 1
Explanation:
As shown in the diagram above, the line chart can be represented with a single line.
Constraints:
1 <= stockPrices.length <= 105stockPrices[i].length == 21 <= dayi, pricei <= 109- All
dayiare distinct.

Solution
Clarifying Questions
When you get asked this question in a real-life environment, it will often be ambiguous (especially at FAANG). Make sure to ask these questions in that case:
- What is the expected data type of the input array's elements? Are they integers or floating-point numbers?
- What are the possible ranges for the y-values in the input points? Can they be negative, zero, or very large?
- If the input array has fewer than two points, what should the function return?
- If all points lie on the same line, should I return 1 or handle it as a special case?
- Is the input array guaranteed to be sorted by x-coordinate, or do I need to sort it first?
Brute Force Solution
Approach
The brute force approach for this problem is to try every possible combination of line segments to represent the chart. We will consider each possible way to split the data points into consecutive groups, where each group represents a line segment.
Here's how the algorithm would work step-by-step:
- Start by assuming that the first two data points define the first line.
- Then, for each remaining data point, check if it falls on the same line as the previous two. If so, keep it on the same line.
- If a data point does NOT fall on the same line, then start a new line segment from the previous point to the current point.
- Record the number of lines required for this specific way of connecting the dots.
- Repeat this process, starting with the first three data points defining the first line, then the first four, and so on, each time checking if subsequent points can be added to the line, and counting the lines required.
- Continue this process, considering every possible starting point and length for the first line.
- After trying all the possibilities, choose the representation that uses the fewest number of lines.
Code Implementation
def minimum_lines_brute_force(points):
    number_of_points = len(points)
    if number_of_points <= 2:
        return 1

    minimum_lines = number_of_points - 1

    for first_line_end in range(1, number_of_points):
        number_of_lines = 1
        current_line_start = 0
        current_line_end = first_line_end

        while current_line_end < number_of_points - 1:
            next_point_index = current_line_end + 1

            # Check if the next point is on the current line.
            if not is_on_line(points[current_line_start], points[current_line_end], points[next_point_index]):

                # Start a new line if the next point doesn't fit.
                number_of_lines += 1
                current_line_start = current_line_end

            current_line_end += 1

        minimum_lines = min(minimum_lines, number_of_lines)

    return minimum_lines

def is_on_line(point1, point2, point3):
    if point1[0] == point2[0]:
        return point3[0] == point1[0]

    # Calculate the slope of the line.
    slope = (point2[1] - point1[1]) / (point2[0] - point1[0])

    # Calculate the y-intercept.
    y_intercept = point1[1] - slope * point1[0]

    # Check if point3 lies on the line.
return abs(point3[1] - (slope * point3[0] + y_intercept)) < 1e-6Big(O) Analysis
Optimal Solution
Approach
To find the fewest lines to represent a line chart, we should greedily group points into lines. We check if consecutive points can form a straight line with the current line and if not, we start a new one.
Here's how the algorithm would work step-by-step:
- Start with the first two points, assuming they form the first line.
- Consider the next point and check if it lies on the same line as the previous two points.
- If the new point does lie on the same line, continue to the next point and repeat the check.
- If the new point does not lie on the same line, count the current line and start a new line with the last point that was on the previous line and the new point.
- Repeat this process until all points have been considered.
- The final count represents the minimum number of lines required.
Code Implementation
def minimum_lines(points):
    number_of_points = len(points)
    if number_of_points <= 1:
        return number_of_points

    number_of_lines = 1
    first_point_index = 0
    second_point_index = 1

    for current_point_index in range(2, number_of_points):
        # Check if the current point lies on the same line
        x1, y1 = points[first_point_index]
        x2, y2 = points[second_point_index]
        x3, y3 = points[current_point_index]

        if (y2 - y1) * (x3 - x2) != (y3 - y2) * (x2 - x1):
            # If not, increment line count and reset
            number_of_lines += 1

            first_point_index = current_point_index - 1

            second_point_index = current_point_index

return number_of_linesBig(O) Analysis
Edge Cases
| Case | How to Handle |
|---|---|
| Empty input array | Return 0 since no lines are needed to represent an empty chart. |
| Input array with only one point | Return 0 since a single point doesn't form a line. |
| Input array with only two points | Return 1 since two points define a single line segment. |
| All points in the array have the same y-value | Return 1 since all points lie on a horizontal line. |
| Points are collinear but not sorted by x-value | The algorithm needs to sort to correctly determine collinearity by checking slopes between adjacent points after sorting. |
| Large input array causing potential integer overflow in slope calculation | Use long or double to store slope values to avoid integer overflow during calculations. |
| Adjacent points have the same x-coordinate (vertical line) | Handle the case of infinite slope by using a flag or a very large number as slope representation or by checking X values before slope calculation. |
| Floating-point precision issues when comparing slopes | Use a small tolerance value (epsilon) when comparing floating-point slopes to account for precision errors. |